Sorry for the lack of posts recently. We had a power line incident and lost the internet for a while. I'm back online and moving the site.
Also! I've been traking the blog hits, and we had 25 hits the day before I stopped posting. So, I'm going to make a post on the Cool Blue Blog, mention this blog again, and hopefully I'll see more and more visitors.
The new address is http://climatechangeskeptic.wordpress.com/ Remember to bookmark it and tell anyone who might be interested.
Friday, March 14, 2008
Thursday, March 6, 2008
Huge Cooling over the Past Year
This article recently appeared on Anthony Watt's website, which showed a massive drop in temperatures in the four main data series (UAH MSU, GISS, HadCRUT, & RSS MSU) from January 2007 to January 2008. Read the article for the graphs and some more details. He has attributed the drop to a combination of La Nina and very small sunspot activity. While this must be recognized as an anomoly in an extremely chaotic and near-random climate system, the magnitude of it is indeed interesting. The climate community is eagerly awaiting February data, and to my knowledge, only UAH has released February 2008 data, which shows a very small uptick in temperatures.
The Beginning of the End
I’m back from the International Conference on Climate Change in NYC, and I have a lot of new science to talk about. But first, I’d like to thank Frank Lopinto from The Cool Blue Blog for recommending my blog to his readers. I also referred several enthusiasts to my website at the conference. I’ll be changing the format of my blog now that I may be attracting readers. Previously, I had run this blog primarily for organizing my own thoughts; for example, my last post was about 3000 words long. Now, I’m going to begin writing shorter, less-technical, more interesting arguments about climate change.
For global warming skeptics, this conference marked the beginning of the end of the anthropogenic (human in origin) global warming scare. The conference was capped at 550 attendees, with 56 Ph.D.s, 9 scientists or economists with other advanced degrees, many other scientific experts, plenty of policy experts, and many enthusiasts, like myself. Such big names as John Coleman (founder of the Weather Channel), Dr. Craig Idso (www.co2science.org), Dr. Craig Loehle (author of a new paleoclimate reconstruction), Dr. Ross McKitrick (works with Steve McIntyre of www.ClimateAudit.org to deconstruct the Hockey Stick graph), Dr. Patrick Michaels (UVA professor), Steven Milloy (www.junkscience.com), Dr. Fred Singer (professor of George Mason University), Dr. Willie Soon (Astrophysicist and Geoscientist at the Solar, Stellar, and Planetary Sciences Division of the Harvard-Smithsonian Center for Astrophysics), Dr. Roy Spencer (very famous research scientist from the University of Alabama at Huntsville), John Stossel (ABC News correspondent who focuses on reporting junk science), and of course, the President of the Czech Republic, Dr. Vaclav Klaus. The schedule made time for several important scientific presentations to the entire audience during breakfast, lunch and dinner, but for the rest of the time, it was divided into six tracks with a total of eight 1.5 hr blocks of time for each track in which two to four experts would speak. The tracks included paleoclimatology, climatology, impacts, economics, politics, and movies. I mostly stayed with the paleoclimatology and climatology tracks, so I have a lot of new information about scientific developments that I’ll talk about in later posts.
Here are a few general observations that I made while I was there.
For many of these scientists, they had only interacted with each other through email, and at this conference, we began to see real organization begin. The Heartland Institute, which ran the conference, is working with the scientists on two projects: to create a scientific journal and peer-review process (I assume/hope) to publish skeptical scientists’ work, which is often received poorly by some hostile scientific journals, and to create a long, 300-400 page, Non-Governmental International Panel on Climate Change (NIPCC) report that would use only information in the IPCC Fourth Assessment Report to refute the claims made in that report.
The cosmic ray theory attracted mixed reactions, though, from what I could tell, most scientists agreed that this theory is the mechanism by which the sun can significantly impact the Earth’s temperature. One scientist, in particular, spoke against the cosmic ray theory on the basis that the data is flawed and manipulated, and the mechanism is impossible. Dr. Willie Soon mentioned this only in passing during his presentation, so I approached him Monday morning during breakfast to ask him to explain. According to Dr. Soon, he used to be at the forefront of cosmic ray research, yet now he completely disagrees with the theory. He said that the Swedish scientists (referring to Svensmark and others) are just looking for some “sexy, new theory,” and that charged particles cannot create clouds in the lower atmosphere because of the abundance of cloud condensation nuclei. I asked him to explain how large ships leave contrail-type clouds behind them, and if that would be an example of creation of clouds in the lower atmosphere through aerosol ionization. He didn’t have a great response to that (yes!), though there very well may be a way to explain it. I plan to read some of Soon’s criticisms of the theory soon.
An interesting theory was proposed by Dr. Ferenc Miskolczi, a relatively unknown European scientist. His theory, through the combination of various atmospheric mathematical laws, essentially states that the optical depth of the greenhouse gases in the atmosphere must remain constant. In other words, the greenhouse effect is cannot be enhanced; as humans add more CO2 into the atmosphere, water vapor (the most important greenhouse gas) leaves in the form of precipitation. He went on to use various observations from both the Earth and Mars to confirm his theory. Although much of the mathematics flew right over the head of many of us in the room, his theory seems to be very strong, and it would have huge implications. Essentially, it means that it would be physically impossible for human emission of greenhouse gases to at all change the temperature of the Earth. He was having a lot of trouble getting this published (no wonder), so this theory hasn’t really been exposed to much scrutiny. I emailed him and asked for his paper, which I then forwarded to Dr. Ben Herman, an expert on this sort of scientific research. He responded, saying that he will read it as soon as he can. When he responds, I’ll post his response and the implications of it. If this theory works, it may finally lay to rest the anthropogenic climate change theory.
This conference was of huge importance to the skeptic community. The amount of organization and networking that was created will be of great use trying to coordinate efforts. The conference was extremely well-run, and hopefully, it will attract many more scientists at next year’s conference in London. The Heartland Institute, which hosted the event, will be posting the PowerPoint presentations made by the various experts, and when that happens, I’ll put up a link.
One quick note about media coverage of the event. The NYT just couldn’t help itself. A relatively unbiased article ended with this: “The meeting was largely framed around science, but after the luncheon, when an organizer made an announcement asking all of the scientists in the large hall to move to the front for a group picture, 19 men did so.” Most of the scientists had already left the room; it would’ve taken very little time for the NYT to go online and find the real numbers that I mentioned.
Thursday, February 28, 2008
The NEW Theory of Climate Change
Before, I get too involved - some vocabulary:
Cosmic Rays=Galactic Cosmic Radiation (GCR)
Solar Wind=Geomagnetic Activity=Interplanetary Magnetic Field (IMF)
Radiant Energy Emitted from the Sun=Total Solar Irradiance (TSI)
w/m^2=watts per square meter
Cloud Condensation Nuclei=CCN
When confronted with about a 0.9 degree C increase in temperature over the past century, we look to the obvious. Aside from the core, which shows no variation in heat output, the Sun is the Earth’s heat source, and it’s the obvious place to turn to explain perceived changes in surface temperature. Yet, we as we investigate this idea, a major problem comes forth. Although observational analysis might imply a correlation between changes in Total Solar Irradiance (a description of the total radiant energy emitted by the sun over all wavelengths), physically, it seems that TSI couldn’t possibly account for the warming experienced since 1900. Radiative output varied only 0.1% over the last solar cycle; this amounts to a mere 0.3 w/m^2 of heat input at the top of the atmosphere. The UN IPCC estimates that the sun can only account for under 0.5 w/m^2 relative to 1750. For comparison, the IPCC suggests that changes in greenhouse gases have had a warming effect of slightly under 2.5 w/m^2 over that same interval.
 Combining these four principles, we can explain how the sun can affect climate. As TSI increases, IMF does as well. Higher IMF intensity blocks more cosmic rays from entering that atmosphere, which means less cloud formation and thus warmer temperatures. I am going to organize the rest of this post to address the theoretical process and observational evidence for each of the five atmospheric phenomenon that the theory relies upon. But first - what are cosmic rays?
 Low clouds, though, still held near-perfect correlation with GC
 R bombardment. Although it seems that this revelation would weaken Svensmark’s argument, it actually helped it because of the properties of clouds. Most climatologists would admit that water vapor and clouds are the two great unknowns of climate, but there are certain principles that we can establish. According to Marsh & Svensmark (I’ll link to the papers later), “High optically thin clouds tend to heat while low clouds, which are generally thick, tend to cool.”


Sources:
Cosmic Rays=Galactic Cosmic Radiation (GCR)
Solar Wind=Geomagnetic Activity=Interplanetary Magnetic Field (IMF)
Radiant Energy Emitted from the Sun=Total Solar Irradiance (TSI)
w/m^2=watts per square meter
Cloud Condensation Nuclei=CCN
When confronted with about a 0.9 degree C increase in temperature over the past century, we look to the obvious. Aside from the core, which shows no variation in heat output, the Sun is the Earth’s heat source, and it’s the obvious place to turn to explain perceived changes in surface temperature. Yet, we as we investigate this idea, a major problem comes forth. Although observational analysis might imply a correlation between changes in Total Solar Irradiance (a description of the total radiant energy emitted by the sun over all wavelengths), physically, it seems that TSI couldn’t possibly account for the warming experienced since 1900. Radiative output varied only 0.1% over the
 last solar cycle; this amounts to a mere 0.3 w/m^2 of heat input at the top of the atmosphere. The UN IPCC estimates that the sun can only account for under 0.5 w/m^2 relative to 1750. For comparison, the IPCC suggests that changes in greenhouse gases have had a warming effect of slightly under 2.5 w/m^2 over that same interval.
So, we seem to be able to rule out changes in TSI as the cause for warming. Next, we have to look to somewhat more complex mechanisms for warming (more complex than the simple heat hits the Earth and warms it theory). Perhaps a change in the chemistry of the atmosphere has altered the way heat is exchanged with space. By increasing the amount of greenhouse gases released into the atmosphere, we reduce the amount of heat that can leave the atmosphere without altering how much heat can enter. In other words, we make the global heat budget imbalanced; more heat is entering than is leaving the system of Earth’s atmosphere. This, at first, appears relatively likely. The correlation between temperature and greenhouse gas levels, though not perfect, is relatively good. So, observational data tells us this theory might work (with some discrepancies like the post-WW2 global cooling), now the question is: could this, physically, be enough of a forcing to account for the observed change in surface temperature? The answer is reliant on what magnitude and sign we determine the water vapor feedback effect has. This is another issue, but theoretically, it
could be large enough to explain the warming.
could be large enough to explain the warming.
Until Dr. Henrik Svensmark, that was the scientific community’s logic. His theory on climate change altered the debate significantly, for it proposed an indirect solar effect that could compete with the enhanced greenhouse effect. The theory defies Occam’s razor, and it proves how little we know about climate. There are five phenomenon that fit together to su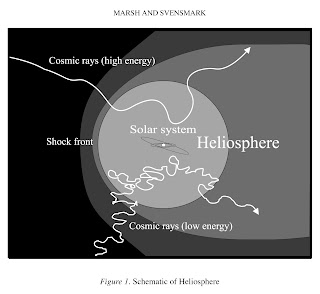 pport this theory.
1. Galactic cosmic radiation (GCR), produced by galactic activity, constantly bombards the Earth.
 pport this theory.
1. Galactic cosmic radiation (GCR), produced by galactic activity, constantly bombards the Earth.
2. Our sun is referred to as a “variable star,” which means it emits both electromagnetic radiation and energetic particles. These energetic particles make up the solar wind, plasma that creates a solar magnetic field throughout the solar system. Changes in TSI affect the strength of the interplanetary magnetic field (IMF).
3. Cosmic rays ionize the lower atmosphere at altitudes of 35km and below.
4. The ionization of the lower atmosphere creates aerosols from which cloud condensation nuclei (CCN) can form.
5. Low clouds increase albedo and cool the Earth.
3. Cosmic rays ionize the lower atmosphere at altitudes of 35km and below.
4. The ionization of the lower atmosphere creates aerosols from which cloud condensation nuclei (CCN) can form.
5. Low clouds increase albedo and cool the Earth.
Combining these four principles, we can explain how the sun can affect climate. As TSI increases, IMF does as well. Higher IMF intensity blocks more cosmic rays from entering that atmosphere, which means less cloud formation and thus warmer temperatures. I am going to organize the rest of this post to address the theoretical process and observational evidence for each of the five atmospheric phenomenon that the theory relies upon. But first - what are cosmic rays?According to a Science Daily Article “Discovered in 1912, cosmic rays are not actually rays at all; they are subatomic particles and ions (such as protons and electrons) that zip through space in all directions at near-light speed, with energies tens of thousands of times greater than particles produced in Earth’s largest particle accelerators. Cosmic rays incessantly bombard Earth, smashing into the atoms and molecules high up in the atmosphere, and producing cascades of secondary particles that reach the surface.”
So where do GCR originate? Unfortunately for us, GCRs vary in energy, and those with the highest energy are the least understood. At the same time, they are incredibly energetic and very rare. Only about 100 GCRs with extremely high energy have ever been observed. While these GCRs are not relevant to the climate change debate (for now…), I’m going to indulge my curiosity a bit and explain the seemingly predominant theory.
So where do GCR originate? Unfortunately for us, GCRs vary in energy, and those with the highest energy are the least understood. At the same time, they are incredibly energetic and very rare. Only about 100 GCRs with extremely high energy have ever been observed. While these GCRs are not relevant to the climate change debate (for now…), I’m going to indulge my curiosity a bit and explain the seemingly predominant theory.
In 1998, an NYU Physicist put forth a theory that GCR originate from extremely distant quasars. The closest quasars are billions of light-years away, and over 100,000 quasars have been identified. Although only decades ago, the scientific community was unsure about the characteristics of quasars, they are now well-understood as halos surrounding supermassive black holes at the center of galaxies. The NYU Physicist Glennys Farrar’s theory is based on observations of the trajectory of extremely high-energy cosmic rays that entered the Earth’s  atmosphere. Farrar was able to trace back the cosmic rays and determine that they originated in quasars. But her theory runs into problems because, traditionally, cosmic rays would be unable to retain energy during the numerous collisions with photons as they travel the distances that Farrar’s theory suggests. So, she argues that cosmic rays are not composed of protons; instead, they are composed of a subatomic particle, SO, which contains three quarks (up, down, and strange). Quarks are the particles that make up subatomic particles like Protons and Neutrons. So that’s the bizarre theory on the origin of the super-high energy cosmic rays. Normal cosmic rays are accelerated by the implosion of large stars in supernovae. This is important, and I will bring it up again later because it could explain the greenhouse-icehouse cycle.
 atmosphere. Farrar was able to trace back the cosmic rays and determine that they originated in quasars. But her theory runs into problems because, traditionally, cosmic rays would be unable to retain energy during the numerous collisions with photons as they travel the distances that Farrar’s theory suggests. So, she argues that cosmic rays are not composed of protons; instead, they are composed of a subatomic particle, SO, which contains three quarks (up, down, and strange). Quarks are the particles that make up subatomic particles like Protons and Neutrons. So that’s the bizarre theory on the origin of the super-high energy cosmic rays. Normal cosmic rays are accelerated by the implosion of large stars in supernovae. This is important, and I will bring it up again later because it could explain the greenhouse-icehouse cycle.
1. GCR bombardment of the Earth. 
There is no controversy surrounding this phenomenon. As I explained, the solar wind is flow of energetic charged particles that block incoming cosmic radiation; the region in which this occurs is called the shock front. Low-energy cosmic rays are sapped of their energy before they make it into the atmosphere, but the more powerful ones are able to make it past the shock front and into the upper atmosphere. When the cosmic radiation hits the atmosphere, showers of secondary particles (protons, neutrons, and muons) are produced by nuclear collisions. These secondary particles continue to travel through the atmosphere, undergoing more collisions and creating even more particles. Around 16km from sea level, the secondary particles have lost too much energy to continue colliding. Below this, electrons and muons (produced by the highest energy cosmic rays) are responsible for the ionization.
 2. Interplanetary Magnetic Field/Solar Wind/Geomagnetic Activity
Here are a few graphs demonstrating the connection between TSI and IMF, along with IMF and related data trends. Note how TSI lags behind IMF by approximately ten years.

There is no controversy surrounding this phenomenon. As I explained, the solar wind is flow of energetic charged particles that block incoming cosmic radiation; the region in which this occurs is called the shock front. Low-energy cosmic rays are sapped of their energy before they make it into the atmosphere, but the more powerful ones are able to make it past the shock front and into the upper atmosphere. When the cosmic radiation hits the atmosphere, showers of secondary particles (protons, neutrons, and muons) are produced by nuclear collisions. These secondary particles continue to travel through the atmosphere, undergoing more collisions and creating even more particles. Around 16km from sea level, the secondary particles have lost too much energy to continue colliding. Below this, electrons and muons (produced by the highest energy cosmic rays) are responsible for the ionization.
2. Interplanetary Magnetic Field/Solar Wind/Geomagnetic ActivityHere are a few graphs demonstrating the connection between TSI and IMF, along with IMF and related data trends. Note how TSI lags behind IMF by approximately ten years.
3./4. Ionization of the Lower Atmosphere/Creation of Clouds
In the very beginnings of this theory, it was believed that cosmic ray bombardment would effect cloud formation at all altitudes. Theoretically, there seemed to be no reason that it wouldn’t, and the observational data of high and low clouds seemed to support the idea (mid-altitude clouds showed no correlation with GCR bombardment). Yet, once the data was updated to include more modern data, it was clear that post-1989 data on middle and high clouds showed absolutely no correlation with the decreasing GCR bombardment.
In the very beginnings of this theory, it was believed that cosmic ray bombardment would effect cloud formation at all altitudes. Theoretically, there seemed to be no reason that it wouldn’t, and the observational data of high and low clouds seemed to support the idea (mid-altitude clouds showed no correlation with GCR bombardment). Yet, once the data was updated to include more modern data, it was clear that post-1989 data on middle and high clouds showed absolutely no correlation with the decreasing GCR bombardment.
Low clouds, though, still held near-perfect correlation with GC R bombardment. Although it seems that this revelation would weaken Svensmark’s argument, it actually helped it because of the properties of clouds. Most climatologists would admit that water vapor and clouds are the two great unknowns of climate, but there are certain principles that we can establish. According to Marsh & Svensmark (I’ll link to the papers later), “High optically thin clouds tend to heat while low clouds, which are generally thick, tend to cool.”
Currently, cloud cover has a 27.7 W/m^2 cooling effect on the Earth, so obviously, changes in cloud cover could have a large impact on the temperature of the Earth, but that impact is dependent upon where the clouds form and what their properties are. Marsh & Svensmark write, “Clouds influence vertically integrated radiative properties of the atmosphere by cooling through reflection of incoming shortwave radiation and heating through the trapping of outgoing longwave radiation.” The low altitude clouds are generally optically thick, and so they have a net negative radiative effect, increasing the albedo (reflectiveness) of the atmosphere. Higher altitude clouds are optically thin; they act to trap heat and add to the greenhouse effect. But low clouds do not merely reflect, they also trap some heat, and high clouds also reflect some heat; albedo can vary from under 10% reflectiveness to over 90%.

Over the past few decades, GCR is clearly very closely correlated to low cloud cover. Because IMF is a solar phenomenon, it contains TSI’s signal with a ten-year cycle, and because low cloud cover closely follows GCR bombardment (which is inversely related to IMF and TSI (though TSI lags behind)), low cloud cover has a ten-year cycle. During that cycle, low cloud cover varies by ~2%; this is calculated to exert a 1.2w/m^2 forcing on the Earth.

Over the past few decades, GCR is clearly very closely correlated to low cloud cover. Because IMF is a solar phenomenon, it contains TSI’s signal with a ten-year cycle, and because low cloud cover closely follows GCR bombardment (which is inversely related to IMF and TSI (though TSI lags behind)), low cloud cover has a ten-year cycle. During that cycle, low cloud cover varies by ~2%; this is calculated to exert a 1.2w/m^2 forcing on the Earth.
The SKY Experiment and the CLOUD Proposal
So we’ve established both the physical and theoretical defense for the theory (though, I admit I skimmed over the actual ionization process because I do not understand it fully), but all good theories must stand the scrutiny of experiment.
So we’ve established both the physical and theoretical defense for the theory (though, I admit I skimmed over the actual ionization process because I do not understand it fully), but all good theories must stand the scrutiny of experiment.
To test the hypothesis that muons (which can be described as heavy electrons) can act as a catalist in the formation of clouds, the SKY Experiment was conducted. In the basement of the National Danish Space Center, natural muons (created through cosmic ray bombardment) entered a 7 cubic meter box containing natural occuring substances at the correct levels in the Earth’s atmosphere. The hypothesis was that “electrons released in the air by passing muons promote the formation of molecular clusters that are building blocks for cloud condensation nuclei.” The experiment confirmed this and actually gave rise to a more efficient means of cloud formation. When electrons enter the atmosphere, they attach to weak formations of water and sulphuric acid clusters and stabilize them, allowing for clouds to form. Yet, in this experiment, the electrons were finished stabilizing the clusters after a mere second, which implied a more efficient mechanism by which electrons could act as catalysts in cloud formation. It was discovered that instead of electrons attaching themselves to one cluster and remaining with that cluster, they would actually attach to a cluster, remain until the cluster is stabilized, and then leave to go stabilize other clusters. In short, the SKY Experiment confirmed the physical mechanism of the GCR theory.
According to the Danish National Space Center website, “The European Organization for Nuclear Research, CERN, is creating an atmospheric research facility at its particle physics laboratory in Geneva. Called CLOUD, it will consist of a special cloud chamber exposed to pulses of high-energy particles from one of CERN’s particle accelerators, the Proton Synchrotron. Conditions prevailing in the Earth’s atmosphere will be recreated in CLOUD, and th e incoming particles will simulate the action of cosmic rays. An elaborate set of instruments will trace the physical and chemical effects of the particle pulses.
 e incoming particles will simulate the action of cosmic rays. An elaborate set of instruments will trace the physical and chemical effects of the particle pulses.
The project was first proposed by Jasper Kirkby of CERN in 1998, in response to the discovery in Copenhagen of an apparent link between cosmic rays and clouds. The name CLOUD is an acronym for ‘cosmics leaving outdoor droplets’. More than fifty atmospheric scientists, solar-terrestrial physicists and particle physicists from seventeen institutes in Europe and the USA joined Kirkby’s team, including Henrik Svensmark and colleagues at the Danish Space Research Institute (now called the Danish National Space Center).” This new project is designed to be more sophisticated than the SKY Experiment, and should be up and running in 2010.
The 111-page long CLOUD proposal reads,
“The primary scientific goals of the CLOUD experiment are as follows:
1. To study the link between cosmic rays and the formation of large ions, aerosol particles, cloud droplets, and ice crystals.
2. To understand the microphysical mechanisms connecting cosmic rays to changes in
aerosol and cloud particle properties.
3. To simulate the effects of cosmic rays on aerosol and cloud properties under atmospheric conditions.”
So we’ve established the physical mechanisms that drive this theory, but we haven’t yet explored the ramifications of it. By comparing trends in the Earth’s temperature and GCR, it seems to suggest that the solar modulation of cosmic rays could be the primary driver of climate on the decadal scale, the millenial scale, and even the multi-million year scale.
A Cosmic Signal in the Icehouse Cycle
Higher levels of cosmic ray flux seem to correspond with the Icehouse cycle, which is characterized by a 100 million year cycle composed of warm periods (hothouses or greenhouses), when no ice or snow exists on Earth, and icehouses, when the Earth bounces back and forth between today’s climate and ice ages.
What may lend credence to this idea is the fact that the Earth passes through the spiral arms of Milky Way every 100 million years. In the arms of the milky, there are m any large, shortlived stars forming and imploding in supernovae. These supernovae send energized cosmic rays hurdling towards the Earth to create clouds and cool the atmosphere. According to Dr. Nir J. Shaviv, cosmic ray fluctuation can explain over 2/3 of the observed temperature variation on this large scale. Our solar system, while rotating through the arms of the Milky Way, also wobbles up and down, through the relatively flat concentration of cosmic activity every 34 million years. According to the Danish National Space Center, “More frequent chilling events, every 34 million years or so, occur whenever the solar system passes through with the mid-plane of the Galaxy.”
 any large, shortlived stars forming and imploding in supernovae. These supernovae send energized cosmic rays hurdling towards the Earth to create clouds and cool the atmosphere. According to Dr. Nir J. Shaviv, cosmic ray fluctuation can explain over 2/3 of the observed temperature variation on this large scale. Our solar system, while rotating through the arms of the Milky Way, also wobbles up and down, through the relatively flat concentration of cosmic activity every 34 million years. According to the Danish National Space Center, “More frequent chilling events, every 34 million years or so, occur whenever the solar system passes through with the mid-plane of the Galaxy.”
Dr. Shaviv has also expressed the possibility that the GCR theory could explain the “Faint Sun Paradox,” the idea that the Earth should have been frozen 4.5 Billion years ago because the total solar output was 30% less than it is today due to the natural processes of the sun. A new sun would rotate faster, creating more solar wind, blocking more cosmic rays, preventing a large amount of cloud cover, and allowing increased warming. According to Shaviv, this phenomenon, coupled with changes in greenhouse gas concentrations could explain the paradox put forth by Carl Sagan.
A Cosmic Signal in Modern Climate 
To determine if temperature and cosmic ray flux correspond over the past millennium, we need to determine what temperature reconstruction to use. I have written one post (with more to come) criticizing Michael Mann’s “hockey stick” reconstruction for being methodologically unsound, intellectually dishonest, and absolutely corrupted by tricky statistical methods, and in its place, I will use Loehle’s 2007 reconstruction, which uses no tree rings, and every set of data has been peer-reviewed and adjusted for local temperature (a feat that has never been accomplished before in paleoclimatology). Loehle’s reconstruction shows a strong warm signal during the Medieval Warm Period (MWP) (900-1300 AD) and a strong cold signal during the Little Ice Age (LIC) (1400-1850). Cosmic ray bombardment d ata shows a very strong correlation with these trends; as shown by the graph, during the MWP, GCR bombardment was especially low, and during the LIC, GCR bombardment was especially high. This correlation that implies GCR flux is the dominant force in cloud cover over long time periods came as somewhat of a surprise. It is important to note that temperatures during the coldest part of the LIC follow the same trend as the solar-modulated GCR flux, rather than TSI itself. Although it seemed possible that changes in GCR flux could significantly alter decadal changes in cloud cover, the suggestion that it could dominate multi-decadal, millennial, and even geological cloud cover despite the massive climate forces and cycles at work is unbelievable, yet, at the same time, the evidence is there to confirm it.

To determine if temperature and cosmic ray flux correspond over the past millennium, we need to determine what temperature reconstruction to use. I have written one post (with more to come) criticizing Michael Mann’s “hockey stick” reconstruction for being methodologically unsound, intellectually dishonest, and absolutely corrupted by tricky statistical methods, and in its place, I will use Loehle’s 2007 reconstruction, which uses no tree rings, and every set of data has been peer-reviewed and adjusted for local temperature (a feat that has never been accomplished before in paleoclimatology). Loehle’s reconstruction shows a strong warm signal during the Medieval Warm Period (MWP) (900-1300 AD) and a strong cold signal during the Little Ice Age (LIC) (1400-1850). Cosmic ray bombardment d
 ata shows a very strong correlation with these trends; as shown by the graph, during the MWP, GCR bombardment was especially low, and during the LIC, GCR bombardment was especially high. This correlation that implies GCR flux is the dominant force in cloud cover over long time periods came as somewhat of a surprise. It is important to note that temperatures during the coldest part of the LIC follow the same trend as the solar-modulated GCR flux, rather than TSI itself. Although it seemed possible that changes in GCR flux could significantly alter decadal changes in cloud cover, the suggestion that it could dominate multi-decadal, millennial, and even geological cloud cover despite the massive climate forces and cycles at work is unbelievable, yet, at the same time, the evidence is there to confirm it.
 Finally! How is this relevant to today’s climate change debate?
In short, it flies in the face of the enhanced greenhouse effect hypothesized by numerous federal agencies, many climate scientists, the UN, and the liberal media. While some warming remains to be explained, the discovery of this cosmic connection lends credibility to the idea that solar variability is a first-order climate forcing. Although I should refrain from making broad, overarching statements, I’m going to go ahead and say that at least 70% of all changes in temperature up until 1980 can be attributed to changes in the solar magnetic field and thus GCR flux. This theory, coupled with increased pollution, even explains the somewhat mysterious global cooling experienced during the post-WW2 era. It is after 1980 that things become slightly more complex. GCR flux, following Solar magnetic field intensity, has continued in its ten-year cycle, but the amplitude of the cycle has remained unchanged, and no upward shift in the cycle has occurred. Over at Real Climate, they claim this as evidence to discredit the entire idea, though they do admit it is an issue that deserves attention. Increasing levels of CO2, global brightening (the reversal of global dimming through the disintegration of post-WW2 aerosol pollutants), and the recent large collective magnitude of the oceanic cycles could all explain recent warming, though increased CO2 levels are most likely playing a greater role in temperature variations.
What does this mean for the future?
http://science.nasa.gov/headlines/y2006/10may_longrange.htm
The 2022 solar sunspot cycle maximum is expected to be extremely weak. While not a perfect correlation, low solar susnpot activity generally goes along with low solar wind intensity. Expect colder weather.
Sources:
Dr. Shaviv's work and information athttp://www.sciencebits.com/ice-ages
Dr. Henrik Svensmark's work at http://www.dsri.dk/~hsv/
The Danish National Space Center at http://www.spacecenter.dk/
Dr. Henrik Svensmark's work at http://www.dsri.dk/~hsv/
The Danish National Space Center at http://www.spacecenter.dk/
Tuesday, February 26, 2008
New Paper Shatters the "Consensus" Myth
There are many methods out there to silence the political opposition, yet, the most effective one is to simply deny the existence of an opposition, and liberals in government along with many in the environmentalist lobby have been employing this technique, successfully convincing the public that no debate exists on the threat of climate change, that there is a scientific consensus.
Now I said I wouldn’t bother delving into the “consensus” debate, but there has been a paper released by
Fergus W.M. Brown, CPE, UCLAN, Preston, UK
Roger A. Pielke Sr. CIRES, University of Colorado, Boulder, CO
James D. Annan, FRCGC/JAMSTEC, Yokohama, Japan.
The paper is Is there agreement amongst climate scientists on the IPCC AR4 WG1?
The text reads,
This recent paper’s results are about what I would have expected; a clear majority of climate scientists agree with the UN or believe it is too conservative in its predictions, yet by no means do the results of the poll justify the description of a “consensus” in the climate science community. This, of course, means that statements made by many in government, especially on the left (although Republicans don’t have a clean record either) have made and continue to make false statements on the state of the debate on climate change. There is no consensus. The debate is not over. The science is not settled. I can think of a lot of issues where much less than 20% of those involved turned out to be wrong. In fact, it would be very interesting to see what percent of climate scientists bought into the “global cooling” scare of the ’70s (This could be large or small; I truly have no idea.).
It may be tempting to say that the science favors the AGW (Anthropogenic Global Warming) proponents because the results of the poll favored them. I would contend that when science becomes politicized, it becomes a business. Activist groups, universities, and government organizations can buy the conclusions that they need. As skeptics are being compared to “holocaust deniers” and as climate change is becoming a human rights issue, universities that are supposed to be supporting open discourse are suppressing it. When the judgment is foregone, the necessity for debate perishes, and academia has allowed this to happen. We must also beware of federal and intergovernmental organizations, for the issue of climate change is a great way to expand bureaucratic power and influence.
The state of open discourse concerning climate change in the global community is horrific. Today, those who stand up against the “consensus” are shot down as “deniers” and few will publicize their opinions. There has even been problems with publishing this specific paper. I quote this next passage from Roger Pielke Sr.’s weblog, Climate Science:
This coming Sunday, Monday, and Tuesday, I will be attending the 2008 International Conference on Climate Change, sponsored by the Heartland Institute. Somewhere around 60 skeptic experts will be speaking, including Craig Loehle and Ross McKitrick (who I will definitely attempt to talk to). Craig Loehle recently published a paper titled A 2000-Year Global Temperature Reconstruction Based on Non-Treering Proxies. This is important because, as Steve McIntyre of ClimateAudit put it,
Now I said I wouldn’t bother delving into the “consensus” debate, but there has been a paper released by
Fergus W.M. Brown, CPE, UCLAN, Preston, UK
Roger A. Pielke Sr. CIRES, University of Colorado, Boulder, CO
James D. Annan, FRCGC/JAMSTEC, Yokohama, Japan.
The paper is Is there agreement amongst climate scientists on the IPCC AR4 WG1?
"ABSTRACT. An online poll of scientists' opinions shows that, while there is strong agreement on the important role of anthropogenically-caused radiative forcing ofCO2 in climate change and with the largest group supporting the IPCC report, there is not a universal agreement among climate scientists about climate science as represented in the IPCC's WG1. The claim that the human input of CO2 is not an important climate forcing is found to be false in our survey. However, there remains substantial disagreement about the magnitude of its impacts. The IPCC WG1 perspective is the mean response, though there are interesting differences between mean responses in the USA and in the EU. There are, also, a significant number of climate scientists who disagree with the IPCC WG1 perspective."
The text reads,
"In our poll, there were 140 responses out of the 1807 who were contacted by the first author. The authors participated along with poll specialist David Jepson (Bsc Hons) in writing the polling questions (see Table 1 for the questions), but had no knowledge of who participated in the polling. It is interesting to note, however, that among the respondents were a substantial number of senior scientists and leading figures in science, whose support and interest in the poll were much appreciated. It is important to recognize that we are not presenting the results as representing anything other than the views of those who responded as we have no way to assess the relationship of the responders with the total relevant population.The results are quite informative. No scientists were willing to admit to the statement that global warming is a fabrication and that human activity is not having any significant effect on climate [0%]. In total, 18% responded that the IPCC AR4 WG1 Report probably
overstates the role of CO2, or exaggerates the risks implied by focusing on
CO2 dominated Anthropogenic Global Warming (AGW), to a greater or lesser degree. A further 17% expressed the opinion that the Report probably underestimates or
seriously underestimates the consequences of anthropogenic CO2 -induced AGW and that the associated risks are more severe than is implied in the report. The remaining 65% expressed some degree of concurrence with the report’s science basis, of which the largest group [47% of all respondents] selected option 5. The exact response rates are given in Figure 1." [Emphasis added.]
Keep in mind that these statistics are based on the 140 responses received out of the 1807 polls sent out. Only a small portion of the climate science community is represented here, and while the numbers may indicate the general position of climate science community, it could be somewhat skewed.(These were the options given in the poll. Options 1-3 were grouped together as scientists who feel the UN IPCC has overstated the threat.)
"Which one statement most nearly matches your personal opinion about the physical science basis of global warming, as exemplified by the IPCC WG1 report?
* [If your personal opinion falls between two adjacent statements, please mark both]
1. There is no warming; it is a fabrication based on inaccurate/inappropriate measurement. Human activity is not having any significant effect on Climate. The data on which such assumptions are made is so compromised as to be worthless. The physical science basis of AGW theory is founded on a false hypothesis.
2. Any recent warming is most likely natural. Human input of CO2 has very little to do with it. Solar, naturally varying water vapour and similar variables can explain most or all of the climate changes. Projections based on Global Climate Models are unreliable because these are based on too many assumptions and unreliable datasets. 3. There are changes in the atmosphere, including added CO2 from human activities, but significant climate effects are likely to be all within natural limits. The ’scares’ are exaggerations with a political motive. The undue emphasis on CO2 diverts attention away from other, important research on climate variability and change.
4. There is warming and the human addition of CO2 causes some of it, but the science is too uncertain to be confident about current attributions of the precise role of CO2 with respect to other climate forcings. The IPCC WG1 overestimates the role of CO2 relative to other forcings, including a diverse variety of human climate forcings.
5. The scientific basis for human impacts on climate is well represented by the IPCC WG1 report. The lead scientists know what they are doing. We are warming the planet, with CO2 as the main culprit. At least some of the forecast consequences of this change are based on robust evidence.
6. The IPCC WG1 is compromised by political intervention; I agree with those scientists who say that the IPCC WG1 is underestimating the problem. Action to reduce human emissions of CO2 in order to mitigate against serious consequences is more urgent than the report suggests. This should be done irrespective of other climate and environmental considerations.
7. The IPCC WG1 seriously understates the human influence on climate. I agree with those scientists who say that major mitigation responses are needed immediately to prevent catastrophic serious warming and other impacts projected to result from human emissions of CO2. We are seriously damaging the Earth’s climate, and will continue to face devastating consequences for many years."
This recent paper’s results are about what I would have expected; a clear majority of climate scientists agree with the UN or believe it is too conservative in its predictions, yet by no means do the results of the poll justify the description of a “consensus” in the climate science community. This, of course, means that statements made by many in government, especially on the left (although Republicans don’t have a clean record either) have made and continue to make false statements on the state of the debate on climate change. There is no consensus. The debate is not over. The science is not settled. I can think of a lot of issues where much less than 20% of those involved turned out to be wrong. In fact, it would be very interesting to see what percent of climate scientists bought into the “global cooling” scare of the ’70s (This could be large or small; I truly have no idea.).
It may be tempting to say that the science favors the AGW (Anthropogenic Global Warming) proponents because the results of the poll favored them. I would contend that when science becomes politicized, it becomes a business. Activist groups, universities, and government organizations can buy the conclusions that they need. As skeptics are being compared to “holocaust deniers” and as climate change is becoming a human rights issue, universities that are supposed to be supporting open discourse are suppressing it. When the judgment is foregone, the necessity for debate perishes, and academia has allowed this to happen. We must also beware of federal and intergovernmental organizations, for the issue of climate change is a great way to expand bureaucratic power and influence.
The state of open discourse concerning climate change in the global community is horrific. Today, those who stand up against the “consensus” are shot down as “deniers” and few will publicize their opinions. There has even been problems with publishing this specific paper. I quote this next passage from Roger Pielke Sr.’s weblog, Climate Science:
"After the survey was completed last summer and the article written, it was submitted to the AGU publication EOS as a “Forum piece. The EOS description of a Forum is that it ”contains thought-provoking contributions expected to stimulate further discussion, within the newspaper or as part of Eos Online Discussions. Appropriate Forum topics include current or proposed science policy, discussion related to current research in our fields especially scientific controversies, the relationship of our science to society, or practices that affect our fields, science in general, or AGU as an organization. Commentary solely on the science reported in research journals is not appropriate.”I would like to conclude by saying that academia must stop treating the climate change issue as a foregone conclusion. There is nothing wrong with encouraging debate, and providing a forum for open discourse is the best way to create leaders for tomorrow. By turning opinion into fact, and by treating contentious issues as simple moral issues, we are creating followers, not leaders for the next century.
Our article certainly fits this description. However, after 4 months without a decision, our contribution was summarily rejected by Fred Spilhous without review. He said our article did not fit EOS policy. We disagreed, of course, based on the explicit EOS policy given above, but our follow request for an appeal was ignored. We then submitted to Nature Precedings where their policy states “Nature Precedings is a
place for researchers to share pre-publication research, unpublished manuscripts,
presentations, posters, white papers, technical papers, supplementary findings, and other scientific documents. Submissions are screened by our professional curation team for relevance and quality, but are not subjected to peer review. We welcome high-quality contributions from biology, medicine (except clinical trials), chemistry and the earth sciences.”
Our article was quickly rejected without explanation.
From this experience, it is clear that the AGU EOS and Nature Precedings Editors are using their positions to suppress evidence that there is more diversity of views on climate, and the human role in altering climate, than is represented in the narrowly focused 2007 IPCC report."
This coming Sunday, Monday, and Tuesday, I will be attending the 2008 International Conference on Climate Change, sponsored by the Heartland Institute. Somewhere around 60 skeptic experts will be speaking, including Craig Loehle and Ross McKitrick (who I will definitely attempt to talk to). Craig Loehle recently published a paper titled A 2000-Year Global Temperature Reconstruction Based on Non-Treering Proxies. This is important because, as Steve McIntyre of ClimateAudit put it,
“… Loehle’s network is the first network to be constructed using series in which every proxy as input to the network has already been calibrated to temperature in a peer reviewed article. This is pretty amazing when you think about it. It’s actually breathtaking. Every prior network has included some, if not a majority, of uncalibrated proxies.”Loehle’s findings were in contradiction to Michael Mann’s hockey stick graph, and in my opinion, Loehle’s reconstruction is much more reliable than Mann’s. Ross McKitrick is part of the McIntyre-McKitrick team that has systematically torn apart Michael Mann’s treering reconstruction. The conference should be very exciting, and many of the big names will be there. When I return, I’ll write up a summary of the presentations.
Sunday, February 24, 2008
Beware the History Channel!
As I was preparing to write a post on Bristlecone Pines and their corruption of the Michael Mann’s “hockey stick” graph, an episode of “Mega Disasters” came on the history channel, and the sentence, “The clock is ticking towards the next climate catastrophe that could effect the entire planet…” caught my attention. The show predicts a climate freefall, specifically, a massive drop in temperature in the coming decades that could spell chaos for Europe and the United States. The show is implicitly referring to the idea of a climate “tipping point,” where temperatures change enough that the circulation of the oceans change, pockets of greenhouse gases trapped in the Earth are released, etc.
Here are a few statements made in the show that epitomize the fear-mongering media at its worst.
“Some scientists predict a ten degree drop in some areas.”
“Raging ice storms with high wind velocity [would] batter New York.”
“Berlin [would be] a snowbound relic of the past.”
“Some scientists predict that this sudden change in climate could occur in our lifetime.”
“Massive blizzards and severe storms could become the new norm in weather in the U.S. and Europe.”
“England, France, Germany might begin to resemble Alaska, Canada.”
Yet, the narrator quickly concedes that “Many climate scientists now discount this potential big freeze.” He never brings up this fact again, and unless the listener was paying very close attention, the rest of the show would make it seem like this idea of massive temperature reversal in the coming decades is accepted in the scientific community.
Later in the show, the narrator states that some scientists disagree. I was expecting that the History Channel would go on to explain the rarity of such an argument in order to maintain some sort of professional integrity; I was mistaken. According to the narrator, those scientists who disagree might contend that the effects will be much harsher in the world outside of Europe and North America.
Now, I’m not arguing that the History Channel has an environmental bias (this show actually attributed the Little Ice Age to weak solar activity!); I would merely like to point out the alarmism that it unintentionally spreads to get more viewers. The hour before this show featured the projection of a global depression and disintegration of civilization (as evidenced by a montage of chaotic videos in the History Channel video library) if we do not change our fossil-fuel dependence within the next few decades. The next hour featured the inevitable tsunami that will destroy the West coast of the United States.
The History Channel is seen as a reliable authority on both historical and modern issues. In my opinion, it loses all credibility when it runs programs like “Mega Disasters” that pay no attention to the science and too much attention to ratings. The theory being presented in this specific episode is not accepted in the scientific community. The Intergovernmental Panel on Climate Change Fourth Assessment Report (the Environmentalist’s holy text) predicts a 2.0 to 11.5 degrees Fahrenheit increase in temperature in the next century . . . not very compatible with a coming ice age. So if the environmentalist community doesn’t buy in to such a proposition, and no skeptic would ever suggest a coming ice age without a large change in solar output, who exactly supports this theory? The media - because its knows how many viewers it can lock in place with a scare show like that.
Thursday, February 14, 2008
Criticism of the "Hockey Stick" #1: Data Mining & A “New” Statistical Method
This will be my first post of hopefully a series of posts criticizing Michael Mann and the MBH98 dataset. His millennial reconstruction is the basis for global warming alarmism, and it has been featured in the 1995, 2001, and 2007 U.N. Intergovernmental Panel on Climate Change reports. Both his flawed statistical methodology and his reliance on unreliable tree-ring proxy make his “hockey stick” reconstruction illegitimate. Many of my arguments are based off of the publications of Steve McIntyre (a data analyst) and Ross McKitrick (an environmental economist), both of whom have been extremely critical of Mann and his colleagues.
McIntyre and McKitrick have been fully endorsed by the Wegman Panel Report (headed by Edward Wegman of George Mason University and the Chairman of the National Academy of Science Committee on Theoretical and Applied Statistics), have testified before Congress, have significantly influenced the National Research Council Report on the issue, have presented to the National Academy of Sciences, has have been published in the Geophysical Research Letters, Energy and Environment, and Nature. McIntyre runs a weblog (www.ClimateAudit.org) in which he uses the statistical skills that he used in the private, mine prospecting sector to analyze claims made in climate science from both sides of the debate. I read it every day, and I find his work to be as unbiased and professional as it is illuminating. In 2007, the site tied for the “Best Science Blog” in the weblog awards in 2007.
In my last post, I wrote three reasons why temperature reconstructions over the past millennium are relevant to the modern global warming debate. For ease of reference, here they are again:
1. It would shed light on the idea that today’s temperatures are out of the natural variability.2. It would possibly correlate temperature with societal development.3. By establishing the behavior of the curve, we would gain greater insight into the strength of solar intensity as a climate modifier. Specifically, if temperatures followed the same trend as solar intensity, then we could suggest that perhaps solar intensity has a dominant role in climate change. Yet, we have to be careful; this is merely speculation. To actually make a scientific case for a strong solar sensitivity, we would have to establish the mechanics by which such a process would work as well as the historical correlation.
Now, the most well-known and publicized reconstruction is often described as the “hockey stick” chart, and those who support it (specifically, authors of Real Climate) are dubbed the “hockey team.” Specifically, the reconstruction is MBH98 (and more recent variations) and the lead scientist is Dr. Michael Mann of Penn State. Here’s what his weblog, Real Climate, says about him:
While I was relatively balanced in my description of paleoclimate issues in the last post, things will begin to change, especially concern Mann and the hockey stick, for it is an issue that I am especially passionate about. Michael Mann’s team has successfully infiltrated television, magazines, textbooks, movies, and popular society with his reconstruction that is filled with deceitful statistical tricks and unreliable tree ring proxies.
The result is a chart with a slightly negative temperature trend until mid-19th century, at which point there is a sharp uptick in global temperatures.
So let’s go back to the three reasons millennial paleoclimate is important.
1. It suggests that modern temperatures are far from natural variability.
2. Any perceived societal development during the Medieval Warm Period would have been unrelated to climate, which shows no upward trend in temperature during that time.
3. Temperature trends seem to closely follow co2 trends, while solar trends seem completely irrelevant. This implies that atmospheric greenhouse gas concentration is the most important climate forcing, which would suggest that modern waming is indeed due to changes in co2, not total solar irradiance (TSI).
For reference, here are three graphs: the Hockey Stick temperature reconstruction, TSI (measured by changes in atmospheric C14 levels), and CO2 concentration.


Now that I have given a brief introduction to the issue, it’s time to start exposing the manipulation that Mann did to achieve the desired reconstruction. This post will look specifically at what Mann described as a “new statistical approach.” What was “new” about it was the way he used Principle Component Analysis (PCA) to mine for the hockey stick shape. In order to effectively draw out trends and use data, the large collection of data from specific proxy reconstructions is condensed into a single series (y). This series takes the form
y = a1x1 + a2x2 + . . . + akxk,
where xn is a single data set, and an is the weight assigned to that data set.
To determine the average of the data, the weight for each data set would be 1/k, so that the entire set would add up to equal 1, but because Mann used PCA, the weights were given different values, dependent upon the variation of the datasets from a given value. This means that the graph of the series will be significantly altered by datasets with large variance, while datasets with low variance will not be very relevant to the end product. This series, y, is referred to as the first Principal Component, PC1. After PC1, there is still some unexplained variance from datasets with less variance. So, PCA also yields PC2, which describes the second Principal Component. This pattern continues until the PC is close to zero. Thus, PCA is an important way to identify variance in a set of data. For PCA to work properly, the data has to be standardized (given a mean of 0 and a variance of 1).
So how did Mann take advantage of this perfectly legitimate method for statistical analysis? To determine the variance, one must determine the mean, and instead of determining the mean for the period under investigation (1400-1980), he applied to mean of the period 1901-1980 to determine the variance. This shouldn’t have caused a lot of issues, for in most of the North American tree ring group, there is not significant variation in temperatures from 1980 back to 1400. Well, actually that’s not completely true, so I need to explain exactly what I mean before I continue. A proxy is defined as an indirect reading of something, in this case - temperature.
When the dendrochronologist reads the width of tree rings, it does not tell him or her the exact temperature of that year. Instead, it gives a width that then can be compared to other years, specifically ones that we know the temperature of through modern instrumental data collection. Through that process, the magnitude of changes in temperaure is established. Therefore, although the temperature magnitude of the changes is large, the departures from the mean over extended periods of time are much smaller, and that is what I mean by my statement that there is no significant variation in temperatures back to 1400 in most of the tree ring proxies.
And although most proxies show no variation (in comparison to previous centuries) beginning in the 1800s, a select few do - specifically, Bristlecone Pine tree rings. Because the mean year to determine variance was set in the 1900s, pre-industrial revolution temperatures are given higher weights, and thus, those Bristlecone Pines are given a tremendous sway in the reconstruction graph. There are significant problems that I will comment on in a later post concerning the use Bristlecones as a proxy, but in this current argument, I’m only trying to show that an undue amount of emphasis was added to these select few proxies from the Southwest USA.
To give an example, the Graybill-Idso Bristlecone proxy was given 390 times more weight than a normal, non-Bristlecone proxy from Mayberry Slough, AR through Mann’s “new” statistical approach. While normal PCA would allow the Graybill-Idso Bristlecone proxies only 8% of the variance, Mann’s technique allows the proxies account for almost 40% of the variance. It is in this manner that Mann et al. essentially “mine” for a hockey stick.
There will be more criticisms to come.
For the papers from which I take my information, visit McIntyre and McKitrick’s project page at http://www.uoguelph.ca/~rmckitri/research/trc.html.
McIntyre and McKitrick have been fully endorsed by the Wegman Panel Report (headed by Edward Wegman of George Mason University and the Chairman of the National Academy of Science Committee on Theoretical and Applied Statistics), have testified before Congress, have significantly influenced the National Research Council Report on the issue, have presented to the National Academy of Sciences, has have been published in the Geophysical Research Letters, Energy and Environment, and Nature. McIntyre runs a weblog (www.ClimateAudit.org) in which he uses the statistical skills that he used in the private, mine prospecting sector to analyze claims made in climate science from both sides of the debate. I read it every day, and I find his work to be as unbiased and professional as it is illuminating. In 2007, the site tied for the “Best Science Blog” in the weblog awards in 2007.
In my last post, I wrote three reasons why temperature reconstructions over the past millennium are relevant to the modern global warming debate. For ease of reference, here they are again:
1. It would shed light on the idea that today’s temperatures are out of the natural variability.2. It would possibly correlate temperature with societal development.3. By establishing the behavior of the curve, we would gain greater insight into the strength of solar intensity as a climate modifier. Specifically, if temperatures followed the same trend as solar intensity, then we could suggest that perhaps solar intensity has a dominant role in climate change. Yet, we have to be careful; this is merely speculation. To actually make a scientific case for a strong solar sensitivity, we would have to establish the mechanics by which such a process would work as well as the historical correlation.

Now, the most well-known and publicized reconstruction is often described as the “hockey stick” chart, and those who support it (specifically, authors of Real Climate) are dubbed the “hockey team.” Specifically, the reconstruction is MBH98 (and more recent variations) and the lead scientist is Dr. Michael Mann of Penn State. Here’s what his weblog, Real Climate, says about him:
Dr. Michael E. Mann is a member of the Penn State University faculty, holding joint positions in the Departments of Meteorology and Geosciences, and the Earth and Environmental Systems Institute (ESSI). He is also director of the Penn State Earth System Science Center (ESSC).
While I was relatively balanced in my description of paleoclimate issues in the last post, things will begin to change, especially concern Mann and the hockey stick, for it is an issue that I am especially passionate about. Michael Mann’s team has successfully infiltrated television, magazines, textbooks, movies, and popular society with his reconstruction that is filled with deceitful statistical tricks and unreliable tree ring proxies.
The result is a chart with a slightly negative temperature trend until mid-19th century, at which point there is a sharp uptick in global temperatures.
So let’s go back to the three reasons millennial paleoclimate is important.
1. It suggests that modern temperatures are far from natural variability.
2. Any perceived societal development during the Medieval Warm Period would have been unrelated to climate, which shows no upward trend in temperature during that time.
3. Temperature trends seem to closely follow co2 trends, while solar trends seem completely irrelevant. This implies that atmospheric greenhouse gas concentration is the most important climate forcing, which would suggest that modern waming is indeed due to changes in co2, not total solar irradiance (TSI).
For reference, here are three graphs: the Hockey Stick temperature reconstruction, TSI (measured by changes in atmospheric C14 levels), and CO2 concentration.


Now that I have given a brief introduction to the issue, it’s time to start exposing the manipulation that Mann did to achieve the desired reconstruction. This post will look specifically at what Mann described as a “new statistical approach.” What was “new” about it was the way he used Principle Component Analysis (PCA) to mine for the hockey stick shape. In order to effectively draw out trends and use data, the large collection of data from specific proxy reconstructions is condensed into a single series (y). This series takes the form
y = a1x1 + a2x2 + . . . + akxk,
where xn is a single data set, and an is the weight assigned to that data set.
To determine the average of the data, the weight for each data set would be 1/k, so that the entire set would add up to equal 1, but because Mann used PCA, the weights were given different values, dependent upon the variation of the datasets from a given value. This means that the graph of the series will be significantly altered by datasets with large variance, while datasets with low variance will not be very relevant to the end product. This series, y, is referred to as the first Principal Component, PC1. After PC1, there is still some unexplained variance from datasets with less variance. So, PCA also yields PC2, which describes the second Principal Component. This pattern continues until the PC is close to zero. Thus, PCA is an important way to identify variance in a set of data. For PCA to work properly, the data has to be standardized (given a mean of 0 and a variance of 1).
So how did Mann take advantage of this perfectly legitimate method for statistical analysis? To determine the variance, one must determine the mean, and instead of determining the mean for the period under investigation (1400-1980), he applied to mean of the period 1901-1980 to determine the variance. This shouldn’t have caused a lot of issues, for in most of the North American tree ring group, there is not significant variation in temperatures from 1980 back to 1400. Well, actually that’s not completely true, so I need to explain exactly what I mean before I continue. A proxy is defined as an indirect reading of something, in this case - temperature.
When the dendrochronologist reads the width of tree rings, it does not tell him or her the exact temperature of that year. Instead, it gives a width that then can be compared to other years, specifically ones that we know the temperature of through modern instrumental data collection. Through that process, the magnitude of changes in temperaure is established. Therefore, although the temperature magnitude of the changes is large, the departures from the mean over extended periods of time are much smaller, and that is what I mean by my statement that there is no significant variation in temperatures back to 1400 in most of the tree ring proxies.
And although most proxies show no variation (in comparison to previous centuries) beginning in the 1800s, a select few do - specifically, Bristlecone Pine tree rings. Because the mean year to determine variance was set in the 1900s, pre-industrial revolution temperatures are given higher weights, and thus, those Bristlecone Pines are given a tremendous sway in the reconstruction graph. There are significant problems that I will comment on in a later post concerning the use Bristlecones as a proxy, but in this current argument, I’m only trying to show that an undue amount of emphasis was added to these select few proxies from the Southwest USA.
To give an example, the Graybill-Idso Bristlecone proxy was given 390 times more weight than a normal, non-Bristlecone proxy from Mayberry Slough, AR through Mann’s “new” statistical approach. While normal PCA would allow the Graybill-Idso Bristlecone proxies only 8% of the variance, Mann’s technique allows the proxies account for almost 40% of the variance. It is in this manner that Mann et al. essentially “mine” for a hockey stick.
There will be more criticisms to come.
For the papers from which I take my information, visit McIntyre and McKitrick’s project page at http://www.uoguelph.ca/~rmckitri/research/trc.html.
Thursday, February 7, 2008
Relevant Events and Cycles in Paleoclimate
While deciding what to name this blog, I attempted to allow for more than simple a debate on what has caused the global warming since 1850, but instead, a look at some more general theories and contested areas within climate science. Yet, many of these contested issues have a direct effect on today’s global warming debate. In this post, I am going to discuss paleoclimatology (climate history), and its relevance to the modern global warming debate.
Before I begin discussing that which is extremely relevant to the global warming debate, I will first cover the Earth’s climate since its conception in order to develop some context. The average temperature of the Earth has been erratic since its beginning around 4.5 billion years ago.
Its temperature has swung between 54 and 72 degrees Fahrenheit, creating and destroying life on Earth. Temperatures were too high in the newly formed Earth at first to form an atmosphere; any gases that did exist would become superheated and escape from the Earth’s gravity. After enough time had passed, the Earth began to cool and hold atmospheric gases. From this creation of an early atmosphere came rain, and that rain produced oceans. The atmosphere then allowed for even greater cooling by blocking a portion of the heat irradiating from the sun and towards the Earth. From this, life was formed. About 530 million years ago, the “Cambrian Explosion” occurred, a time when complex animals began to come into existence, and when a major diversification of other organisms took place. It was around this time that the ozone layer formed, and climate as we know it today came into existence. After the Cambrian explosion, a cycle of “ice houses” and “green houses” began.
 For the majority of the Earth’s post-Cambrian explosion life, it has been warmer than it is today. In fact, during these warm “green houses,” there is not a single frozen lake or snowflake on Earth. In between “green houses” exist the “ice houses,” of which there have been three, and humans inhabit the third. Ice houses last 30 to 50 million years; ours is 20 million years old, so no need to worry about that for at least another 10 million years. The graph below shows the Earth sliding out of the last “green house,” specifically the Eocene Maximum, and into the “ice house” that we now inhabit.
In the top left corner of the graph, an acronym that reads PETM (Paleocene Eocene Thermal Maximum) is placed next to what appears to be a dramatically sharp rise and fall off of global temperature. Three theories exist for the cause of the PETM: the first theory is that reservoirs of methane were released by warming temperatures, causing a runaway greenhouse effect; the second theory is that the PETM was caused by a comet striking the Earth; and the third theory is that a large oceanic volcano erupted, spewing gases into the atmosphere. While I have absolutely nothing to contribute to that debate, it is important to note that that debate is a microcosm of the modern global warming debate surrounding “runaway” warming and climate sensitivity to greenhouse gases, such as methane.
Also, it is important to notice the erratic behavior of temperature nearing modern times. This next graph zooms in on the temperature behavior, showing that the behavior is very cyclical.
This thermal cycle can most likely be attributed to the Milankovitch Cycle, which is the collective effect of the changes in the Earth’s eccentricity, axial tilt, an precession, all of which effect the amount of solar radiation reaching the Earth. But, the cycle alone cannot explain the entirety of the warming and cooling, and so ice sheet dynamics and greenhouse gases must play a part, amplifying the direct effect of solar radiation. A question that I can pursue later when I have time is if solar wind intensity changes significantly as the Earth moves closer to the Sun, and if robust cosmic ray data exists on the 100,000-year scale. If they do change significantly, then less positive feedback from greenhouse gases would be needed to amplify the effect of the Milankovitch Cycle, and this would have major implications for the modern debate. I’m sure that some scientist is way ahead of me, so I’ll look into it and find an answer soon. I will explain the mechanics of cosmic rays and solar winds in a later post.
Within these interglacial and glacial periods, there is significant temperature oscillation on the millennial scale, but the climate science community is far from agreement on the behavior of temperature over the past millennium. While establishing paleoclimatic trends back a hundred thousand, a million, or even a billion years ago is important (and even, on occasion, can provide insight to today’s debate), the most contested issue is clearly temperature trends over the past millennium for several reasons:
1. It would shed light on the idea that today’s temperatures are out of the natural variability.
2. It would possibly correlate temperature with societal development.
3. By establishing the behavior of the curve, we would gain greater insight into the strength of solar intensity as a climate modifier. Specifically, if temperatures followed the same trend as solar intensity, then we could suggest that perhaps solar intensity has a dominant role in climate change. Yet, we have to be careful; this is merely speculation. To actually make a scientific case for a strong solar sensitivity, we would have to establish the mechanics by which such a process would work as well as the historical correlation.
My purpose in writing this post was to briefly cover all of the different events throughout the history of climate on Earth that are important in the global warming debate. The cause of ice houses and green houses, the cause of the Paleocene-Eocene Thermal Maximum, and the cause of the ice age cycle are microcosms of today’s debate on the cause of 20th century warming. Establishing the cause of the various thermal events in paleoclimate would help to determine the sensitivity of the Earth’s temperature to changes in greenhouse gas concentration.
Before I begin discussing that which is extremely relevant to the global warming debate, I will first cover the Earth’s climate since its conception in order to develop some context. The average temperature of the Earth has been erratic since its beginning around 4.5 billion years ago.
Its temperature has swung between 54 and 72 degrees Fahrenheit, creating and destroying life on Earth. Temperatures were too high in the newly formed Earth at first to form an atmosphere; any gases that did exist would become superheated and escape from the Earth’s gravity. After enough time had passed, the Earth began to cool and hold atmospheric gases. From this creation of an early atmosphere came rain, and that rain produced oceans. The atmosphere then allowed for even greater cooling by blocking a portion of the heat irradiating from the sun and towards the Earth. From this, life was formed. About 530 million years ago, the “Cambrian Explosion” occurred, a time when complex animals began to come into existence, and when a major diversification of other organisms took place. It was around this time that the ozone layer formed, and climate as we know it today came into existence. After the Cambrian explosion, a cycle of “ice houses” and “green houses” began.
For the majority of the Earth’s post-Cambrian explosion life, it has been warmer than it is today. In fact, during these warm “green houses,” there is not a single frozen lake or snowflake on Earth. In between “green houses” exist the “ice houses,” of which there have been three, and humans inhabit the third. Ice houses last 30 to 50 million years; ours is 20 million years old, so no need to worry about that for at least another 10 million years. The graph below shows the Earth sliding out of the last “green house,” specifically the Eocene Maximum, and into the “ice house” that we now inhabit. One theory for this 140 million year cycle is that the Earth reacts to increased cosmic ray bombardment as it proceeds through the spiral arms of the milky way. I will describe the process by which cosmic rays can influence climate in a later post, but essentially, if this theory were true, it would give more credibility to the suggestion that the sun has caused modern global warming.
In the top left corner of the graph, an acronym that reads PETM (Paleocene Eocene Thermal Maximum) is placed next to what appears to be a dramatically sharp rise and fall off of global temperature. Three theories exist for the cause of the PETM: the first theory is that reservoirs of methane were released by warming temperatures, causing a runaway greenhouse effect; the second theory is that the PETM was caused by a comet striking the Earth; and the third theory is that a large oceanic volcano erupted, spewing gases into the atmosphere. While I have absolutely nothing to contribute to that debate, it is important to note that that debate is a microcosm of the modern global warming debate surrounding “runaway” warming and climate sensitivity to greenhouse gases, such as methane.
Also, it is important to notice the erratic behavior of temperature nearing modern times. This next graph zooms in on the temperature behavior, showing that the behavior is very cyclical.
Each cycle lasts approximately 100,000 years, and climate oscillates between glacial periods and interglacial periods. These glacial periods are referred to as “ice ages” in popular culture, and they occur for the majority of time while in an ice house. During these ice ages, glaciers stretch inward towards the equator, and life is forced to adapt to frigidly cold temperatures. Every 100,000 years, climate shoots up ten degrees Celsius into an interglacial period, like the one we currently inhabit. Yet, these periods are short-lived, and there is very little agreement on when this interglacial period will end. Some say that the Earth is already heading back into a glaciation (Imbrie and Imbrie), while others contend that we have another 50,000 years of warm climate ahead of us (Berger and Loutre).
This thermal cycle can most likely be attributed to the Milankovitch Cycle, which is the collective effect of the changes in the Earth’s eccentricity, axial tilt, an precession, all of which effect the amount of solar radiation reaching the Earth. But, the cycle alone cannot explain the entirety of the warming and cooling, and so ice sheet dynamics and greenhouse gases must play a part, amplifying the direct effect of solar radiation. A question that I can pursue later when I have time is if solar wind intensity changes significantly as the Earth moves closer to the Sun, and if robust cosmic ray data exists on the 100,000-year scale. If they do change significantly, then less positive feedback from greenhouse gases would be needed to amplify the effect of the Milankovitch Cycle, and this would have major implications for the modern debate. I’m sure that some scientist is way ahead of me, so I’ll look into it and find an answer soon. I will explain the mechanics of cosmic rays and solar winds in a later post.
Within these interglacial and glacial periods, there is significant temperature oscillation on the millennial scale, but the climate science community is far from agreement on the behavior of temperature over the past millennium. While establishing paleoclimatic trends back a hundred thousand, a million, or even a billion years ago is important (and even, on occasion, can provide insight to today’s debate), the most contested issue is clearly temperature trends over the past millennium for several reasons:
1. It would shed light on the idea that today’s temperatures are out of the natural variability.
2. It would possibly correlate temperature with societal development.
3. By establishing the behavior of the curve, we would gain greater insight into the strength of solar intensity as a climate modifier. Specifically, if temperatures followed the same trend as solar intensity, then we could suggest that perhaps solar intensity has a dominant role in climate change. Yet, we have to be careful; this is merely speculation. To actually make a scientific case for a strong solar sensitivity, we would have to establish the mechanics by which such a process would work as well as the historical correlation.
My purpose in writing this post was to briefly cover all of the different events throughout the history of climate on Earth that are important in the global warming debate. The cause of ice houses and green houses, the cause of the Paleocene-Eocene Thermal Maximum, and the cause of the ice age cycle are microcosms of today’s debate on the cause of 20th century warming. Establishing the cause of the various thermal events in paleoclimate would help to determine the sensitivity of the Earth’s temperature to changes in greenhouse gas concentration.
My next post will most likely focus on the validity and implicatons of different reconstructions of the Earth's temperature over the past thousand years.
Tuesday, February 5, 2008
Summary of My Position
To provide some background on the view that I will be presenting on this website, I'm describing my position on "global warming" and climate science in general in this post. Bear in mind that my position to the issue as a whole will vary over time, and that the attitude that this blog portrays will not be static.

My view is that changes in solar intensity are responsible for "climate change" that can not be related to volcanoes, meteorites, and other statistically random phenomenon on both large and small time-scales. I would argue that the sun has played a dominant role in climate on the scale of hundreds of millions of years, and even on the scale of ten years. This does not mean that humans have not changed the environment they inhabit, for the certainly have. An increase in the concentration of CO2 in the atmosphere will cause and has caused warming; the question is: how much can be attributed to changes in solar intensity and how much can be attributed to changes in the concentration of greenhouse gases in the atmosphere? My best guess is that changes in CO2 level had very little effect until around 1970; my best guess is 10-40% of warming since then has been caused by changes in CO2 concentration.
Over the past fifty years, humans have been playing more and more of a role in climate, but in much more diverse ways than just greenhouse gas emissions. Land use and pollution are altering the atmosphere in more complex ways than simply global surface temperatures. For example, the industrial boom that occurred post-WWII produced a large amount of pollutants, namely "aerosols," small particulates that reflect sunlight. This reflective property is called albedo, and aerosols contribute to global albedo in two ways. First, there is the direct effect of sunlight reflected by particulates in the atmosphere. Second, there is the indirect effect of cloud formation. The aerosol particulates act as cloud condensation nuclei (CCN), from which clouds form, yet they also alter the lifespan of clouds, and theorizing the net radiative effect from this indirect effect is extremely difficult. What we can say for certainty is that both the indirect and the direct effect cause a negative radiative effect on the Earth; in other words, pollution cools the Earth. But pollutants don't stay in the atmosphere indefinately. Over time, depending on the particular type of aerosol, the pollutant breaks down. This has been occurring since the end of WWII, and the level of aerosols in the atmosphere has been significantly decreasing. The changes in aerosol levels share responsibility with changes in solar intensity, atmospheric CO2 concentration, and shifting oceanic cycles for creating the hotly-debated change in surface temperature since 1970.
Yet, we should remember that just because something is anthropogenic (human in origin), it does not mean that it is bad. There is a case to be made that increased CO2 concentration will help plant growth, which fuels increased animal population. Although I am not knowledgeable enough on the topic to declare an opinion, The Oregon Petition Project, signed by 19,000 American scientists who would today be described as "deniers," reads,
"There is no convincing scientific evidence that human release of carbon dioxide, methane, or other greenhouse gasses is causing or will, in the foreseeable future, cause catastrophic heating of the Earth's atmosphere and disruption of the Earth's climate. Moreover, there is substantial scientific evidence that increases in atmospheric carbon dioxide produce many beneficial effects upon the natural plant and animal environments of the Earth."
Hopefully this is an issue that I will be able to cover more thoroughly on this blog. So if increased CO2 concentrations might be a good thing, what about global warming? Why are we so certain that the global warming that the UN IPCC projects would be a bad thing. Now here's the irony: On April 28, 1975, Newsweek published an article entitled, "The Cooling World."

Strangely reminiscent of the modern global warming scare, this article focused on cooling that had occurred from 1942 to 1970 (a globally-averaged change of only .6 degrees Fahrenheit). The article predicted major food shortages (sound familiar?) and extreme weather (even more familiar?). It reads,
"Last April, in the most devastating outbreak of tornadoes ever recorded, 148 twisters killed more than 300 people and caused half a billion dollars' worth of damage in 13 U.S. states."
The article goes on to attribute this outbreak to global cooling, and thus we are able to infer that the activist community believes that temperatures below the 1942 average global surface temperature would be harmful to humans, while temperatures above would be fine. Well, temperatures stopped falling and began to increase, and soon the temperatures exceeded the 1942 high, causing the environmental activist community to cry out at the climatic chaos looming ahead.
The article goes on to attribute this outbreak to global cooling, and thus we are able to infer that the activist community believes that temperatures below the 1942 average global surface temperature would be harmful to humans, while temperatures above would be fine. Well, temperatures stopped falling and began to increase, and soon the temperatures exceeded the 1942 high, causing the environmental activist community to cry out at the climatic chaos looming ahead.
There we have it - the environmental community believes that the temperature of 1942 is the optimal temperature. Ridiculous! Climate has always been changing, and climate will forever be changing. Sometimes these changes will better humanity and sometimes they will hurt, but either way, science has not identified any optimal temperature for climate, so until then, the media should stop with the apocalypse news stories about a 1 degree Celsius increase in temperature. NASA administrator Michael Griffin also shares my concern, and he told NPR:
"To assume that it is a problem is to assume that the state of Earth's climate today is the optimal climate, the best climate that we could have or ever have had and that we need to take steps to make sure that it doesn't change. First of all, I don't think it's within the power of human beings to assure that the climate does not change, as millions of years of history have shown. And second of all, I guess I would ask which human beings — where and when — are to be accorded the privilege of deciding that this particular climate that we have right here today, right now is the best climate for all other human beings. I think that's a rather arrogant position for people to take."
Well said, Mr. Griffin.
The way the media, academia, and politicians have gone after the issue of global warming has been shameful. The use of the word "consensus" is particularly repulsive to me, yet society has accepted the false premise of a climate consensus, when in actuality, there is no validity to such an argument.
Yet, the idea continues, abundant in Western culture. Just recently, I attended a model UN conference in Philadelphia, and the guest speaker was involved with climate change at the UN. Of course, he couldn't help but lie to the thousands of students sitting in the auditorium, telling them that there is a "consensus" on climate change. Classes in high schools and universities are taught the "consensus" line - talk about stimulating intellectual diversity. . . .
A perfect example of hostility towards disention is the Weather Channel's Heidi Cullen. Here's an excerpt from what she posted on her blog:
"If a meteorologist can't speak to the fundamental science of climate change, then maybe the AMS shouldn't give them a Seal of Approval. Clearly, the AMS doesn't agree that global warming can be blamed on cyclical weather patterns."
Alabama meteorologist James Spann fired back, saying,
"I have been in operational meteorology since 1978, and I know dozens and dozens of broadcast meteorologists all over the country. Our big job: look at a large volume of raw data and come up with a public weather forecast for the next seven days. I do not know of a single TV meteorologist who buys into the man-made global warming hype. I know there must be a few out there, but I can’t find them."
I won't bother making a case for the lack of "consensus," for I don't want to waste my time or yours, and I will be discussing many skeptical scientists in my future posts anyways.
In the media and government, skeptics have no voice. But here on the internet, we can express our views in the free exchange of ideas that Western culture has so successfully destroyed.
By the way - my next few posts will be introducing the debate. After that, I will begin to discuss more complex, less broad, scientific issues.
Subscribe to:
Posts (Atom)