Cosmic Rays=Galactic Cosmic Radiation (GCR)
Solar Wind=Geomagnetic Activity=Interplanetary Magnetic Field (IMF)
Radiant Energy Emitted from the Sun=Total Solar Irradiance (TSI)
w/m^2=watts per square meter
Cloud Condensation Nuclei=CCN
When confronted with about a 0.9 degree C increase in temperature over the past century, we look to the obvious. Aside from the core, which shows no variation in heat output, the Sun is the Earth’s heat source, and it’s the obvious place to turn to explain perceived changes in surface temperature. Yet, we as we investigate this idea, a major problem comes forth. Although observational analysis might imply a correlation between changes in Total Solar Irradiance (a description of the total radiant energy emitted by the sun over all wavelengths), physically, it seems that TSI couldn’t possibly account for the warming experienced since 1900. Radiative output varied only 0.1% over the
 last solar cycle; this amounts to a mere 0.3 w/m^2 of heat input at the top of the atmosphere. The UN IPCC estimates that the sun can only account for under 0.5 w/m^2 relative to 1750. For comparison, the IPCC suggests that changes in greenhouse gases have had a warming effect of slightly under 2.5 w/m^2 over that same interval.
So, we seem to be able to rule out changes in TSI as the cause for warming. Next, we have to look to somewhat more complex mechanisms for warming (more complex than the simple heat hits the Earth and warms it theory). Perhaps a change in the chemistry of the atmosphere has altered the way heat is exchanged with space. By increasing the amount of greenhouse gases released into the atmosphere, we reduce the amount of heat that can leave the atmosphere without altering how much heat can enter. In other words, we make the global heat budget imbalanced; more heat is entering than is leaving the system of Earth’s atmosphere. This, at first, appears relatively likely. The correlation between temperature and greenhouse gas levels, though not perfect, is relatively good. So, observational data tells us this theory might work (with some discrepancies like the post-WW2 global cooling), now the question is: could this, physically, be enough of a forcing to account for the observed change in surface temperature? The answer is reliant on what magnitude and sign we determine the water vapor feedback effect has. This is another issue, but theoretically, it
could be large enough to explain the warming.
could be large enough to explain the warming.
Until Dr. Henrik Svensmark, that was the scientific community’s logic. His theory on climate change altered the debate significantly, for it proposed an indirect solar effect that could compete with the enhanced greenhouse effect. The theory defies Occam’s razor, and it proves how little we know about climate. There are five phenomenon that fit together to su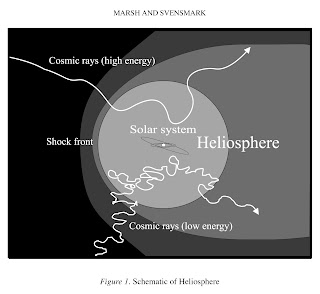 pport this theory.
1. Galactic cosmic radiation (GCR), produced by galactic activity, constantly bombards the Earth.
 pport this theory.
1. Galactic cosmic radiation (GCR), produced by galactic activity, constantly bombards the Earth.
2. Our sun is referred to as a “variable star,” which means it emits both electromagnetic radiation and energetic particles. These energetic particles make up the solar wind, plasma that creates a solar magnetic field throughout the solar system. Changes in TSI affect the strength of the interplanetary magnetic field (IMF).
3. Cosmic rays ionize the lower atmosphere at altitudes of 35km and below.
4. The ionization of the lower atmosphere creates aerosols from which cloud condensation nuclei (CCN) can form.
5. Low clouds increase albedo and cool the Earth.
3. Cosmic rays ionize the lower atmosphere at altitudes of 35km and below.
4. The ionization of the lower atmosphere creates aerosols from which cloud condensation nuclei (CCN) can form.
5. Low clouds increase albedo and cool the Earth.
 Combining these four principles, we can explain how the sun can affect climate. As TSI increases, IMF does as well. Higher IMF intensity blocks more cosmic rays from entering that atmosphere, which means less cloud formation and thus warmer temperatures. I am going to organize the rest of this post to address the theoretical process and observational evidence for each of the five atmospheric phenomenon that the theory relies upon. But first - what are cosmic rays?
According to a Science Daily Article “Discovered in 1912, cosmic rays are not actually rays at all; they are subatomic particles and ions (such as protons and electrons) that zip through space in all directions at near-light speed, with energies tens of thousands of times greater than particles produced in Earth’s largest particle accelerators. Cosmic rays incessantly bombard Earth, smashing into the atoms and molecules high up in the atmosphere, and producing cascades of secondary particles that reach the surface.”
So where do GCR originate? Unfortunately for us, GCRs vary in energy, and those with the highest energy are the least understood. At the same time, they are incredibly energetic and very rare. Only about 100 GCRs with extremely high energy have ever been observed. While these GCRs are not relevant to the climate change debate (for now…), I’m going to indulge my curiosity a bit and explain the seemingly predominant theory.
So where do GCR originate? Unfortunately for us, GCRs vary in energy, and those with the highest energy are the least understood. At the same time, they are incredibly energetic and very rare. Only about 100 GCRs with extremely high energy have ever been observed. While these GCRs are not relevant to the climate change debate (for now…), I’m going to indulge my curiosity a bit and explain the seemingly predominant theory.
In 1998, an NYU Physicist put forth a theory that GCR originate from extremely distant quasars. The closest quasars are billions of light-years away, and over 100,000 quasars have been identified. Although only decades ago, the scientific community was unsure about the characteristics of quasars, they are now well-understood as halos surrounding supermassive black holes at the center of galaxies. The NYU Physicist Glennys Farrar’s theory is based on observations of the trajectory of extremely high-energy cosmic rays that entered the Earth’s  atmosphere. Farrar was able to trace back the cosmic rays and determine that they originated in quasars. But her theory runs into problems because, traditionally, cosmic rays would be unable to retain energy during the numerous collisions with photons as they travel the distances that Farrar’s theory suggests. So, she argues that cosmic rays are not composed of protons; instead, they are composed of a subatomic particle, SO, which contains three quarks (up, down, and strange). Quarks are the particles that make up subatomic particles like Protons and Neutrons. So that’s the bizarre theory on the origin of the super-high energy cosmic rays. Normal cosmic rays are accelerated by the implosion of large stars in supernovae. This is important, and I will bring it up again later because it could explain the greenhouse-icehouse cycle.
 atmosphere. Farrar was able to trace back the cosmic rays and determine that they originated in quasars. But her theory runs into problems because, traditionally, cosmic rays would be unable to retain energy during the numerous collisions with photons as they travel the distances that Farrar’s theory suggests. So, she argues that cosmic rays are not composed of protons; instead, they are composed of a subatomic particle, SO, which contains three quarks (up, down, and strange). Quarks are the particles that make up subatomic particles like Protons and Neutrons. So that’s the bizarre theory on the origin of the super-high energy cosmic rays. Normal cosmic rays are accelerated by the implosion of large stars in supernovae. This is important, and I will bring it up again later because it could explain the greenhouse-icehouse cycle.
1. GCR bombardment of the Earth. 
There is no controversy surrounding this phenomenon. As I explained, the solar wind is flow of energetic charged particles that block incoming cosmic radiation; the region in which this occurs is called the shock front. Low-energy cosmic rays are sapped of their energy before they make it into the atmosphere, but the more powerful ones are able to make it past the shock front and into the upper atmosphere. When the cosmic radiation hits the atmosphere, showers of secondary particles (protons, neutrons, and muons) are produced by nuclear collisions. These secondary particles continue to travel through the atmosphere, undergoing more collisions and creating even more particles. Around 16km from sea level, the secondary particles have lost too much energy to continue colliding. Below this, electrons and muons (produced by the highest energy cosmic rays) are responsible for the ionization.
 2. Interplanetary Magnetic Field/Solar Wind/Geomagnetic Activity
Here are a few graphs demonstrating the connection between TSI and IMF, along with IMF and related data trends. Note how TSI lags behind IMF by approximately ten years.

There is no controversy surrounding this phenomenon. As I explained, the solar wind is flow of energetic charged particles that block incoming cosmic radiation; the region in which this occurs is called the shock front. Low-energy cosmic rays are sapped of their energy before they make it into the atmosphere, but the more powerful ones are able to make it past the shock front and into the upper atmosphere. When the cosmic radiation hits the atmosphere, showers of secondary particles (protons, neutrons, and muons) are produced by nuclear collisions. These secondary particles continue to travel through the atmosphere, undergoing more collisions and creating even more particles. Around 16km from sea level, the secondary particles have lost too much energy to continue colliding. Below this, electrons and muons (produced by the highest energy cosmic rays) are responsible for the ionization.
2. Interplanetary Magnetic Field/Solar Wind/Geomagnetic ActivityHere are a few graphs demonstrating the connection between TSI and IMF, along with IMF and related data trends. Note how TSI lags behind IMF by approximately ten years.
3./4. Ionization of the Lower Atmosphere/Creation of Clouds
In the very beginnings of this theory, it was believed that cosmic ray bombardment would effect cloud formation at all altitudes. Theoretically, there seemed to be no reason that it wouldn’t, and the observational data of high and low clouds seemed to support the idea (mid-altitude clouds showed no correlation with GCR bombardment). Yet, once the data was updated to include more modern data, it was clear that post-1989 data on middle and high clouds showed absolutely no correlation with the decreasing GCR bombardment.
In the very beginnings of this theory, it was believed that cosmic ray bombardment would effect cloud formation at all altitudes. Theoretically, there seemed to be no reason that it wouldn’t, and the observational data of high and low clouds seemed to support the idea (mid-altitude clouds showed no correlation with GCR bombardment). Yet, once the data was updated to include more modern data, it was clear that post-1989 data on middle and high clouds showed absolutely no correlation with the decreasing GCR bombardment.
 Low clouds, though, still held near-perfect correlation with GC
 R bombardment. Although it seems that this revelation would weaken Svensmark’s argument, it actually helped it because of the properties of clouds. Most climatologists would admit that water vapor and clouds are the two great unknowns of climate, but there are certain principles that we can establish. According to Marsh & Svensmark (I’ll link to the papers later), “High optically thin clouds tend to heat while low clouds, which are generally thick, tend to cool.”
Currently, cloud cover has a 27.7 W/m^2 cooling effect on the Earth, so obviously, changes in cloud cover could have a large impact on the temperature of the Earth, but that impact is dependent upon where the clouds form and what their properties are. Marsh & Svensmark write, “Clouds influence vertically integrated radiative properties of the atmosphere by cooling through reflection of incoming shortwave radiation and heating through the trapping of outgoing longwave radiation.” The low altitude clouds are generally optically thick, and so they have a net negative radiative effect, increasing the albedo (reflectiveness) of the atmosphere. Higher altitude clouds are optically thin; they act to trap heat and add to the greenhouse effect. But low clouds do not merely reflect, they also trap some heat, and high clouds also reflect some heat; albedo can vary from under 10% reflectiveness to over 90%.

Over the past few decades, GCR is clearly very closely correlated to low cloud cover. Because IMF is a solar phenomenon, it contains TSI’s signal with a ten-year cycle, and because low cloud cover closely follows GCR bombardment (which is inversely related to IMF and TSI (though TSI lags behind)), low cloud cover has a ten-year cycle. During that cycle, low cloud cover varies by ~2%; this is calculated to exert a 1.2w/m^2 forcing on the Earth.

Over the past few decades, GCR is clearly very closely correlated to low cloud cover. Because IMF is a solar phenomenon, it contains TSI’s signal with a ten-year cycle, and because low cloud cover closely follows GCR bombardment (which is inversely related to IMF and TSI (though TSI lags behind)), low cloud cover has a ten-year cycle. During that cycle, low cloud cover varies by ~2%; this is calculated to exert a 1.2w/m^2 forcing on the Earth.
The SKY Experiment and the CLOUD Proposal
So we’ve established both the physical and theoretical defense for the theory (though, I admit I skimmed over the actual ionization process because I do not understand it fully), but all good theories must stand the scrutiny of experiment.
So we’ve established both the physical and theoretical defense for the theory (though, I admit I skimmed over the actual ionization process because I do not understand it fully), but all good theories must stand the scrutiny of experiment.
To test the hypothesis that muons (which can be described as heavy electrons) can act as a catalist in the formation of clouds, the SKY Experiment was conducted. In the basement of the National Danish Space Center, natural muons (created through cosmic ray bombardment) entered a 7 cubic meter box containing natural occuring substances at the correct levels in the Earth’s atmosphere. The hypothesis was that “electrons released in the air by passing muons promote the formation of molecular clusters that are building blocks for cloud condensation nuclei.” The experiment confirmed this and actually gave rise to a more efficient means of cloud formation. When electrons enter the atmosphere, they attach to weak formations of water and sulphuric acid clusters and stabilize them, allowing for clouds to form. Yet, in this experiment, the electrons were finished stabilizing the clusters after a mere second, which implied a more efficient mechanism by which electrons could act as catalysts in cloud formation. It was discovered that instead of electrons attaching themselves to one cluster and remaining with that cluster, they would actually attach to a cluster, remain until the cluster is stabilized, and then leave to go stabilize other clusters. In short, the SKY Experiment confirmed the physical mechanism of the GCR theory.
According to the Danish National Space Center website, “The European Organization for Nuclear Research, CERN, is creating an atmospheric research facility at its particle physics laboratory in Geneva. Called CLOUD, it will consist of a special cloud chamber exposed to pulses of high-energy particles from one of CERN’s particle accelerators, the Proton Synchrotron. Conditions prevailing in the Earth’s atmosphere will be recreated in CLOUD, and th e incoming particles will simulate the action of cosmic rays. An elaborate set of instruments will trace the physical and chemical effects of the particle pulses.
 e incoming particles will simulate the action of cosmic rays. An elaborate set of instruments will trace the physical and chemical effects of the particle pulses.
The project was first proposed by Jasper Kirkby of CERN in 1998, in response to the discovery in Copenhagen of an apparent link between cosmic rays and clouds. The name CLOUD is an acronym for ‘cosmics leaving outdoor droplets’. More than fifty atmospheric scientists, solar-terrestrial physicists and particle physicists from seventeen institutes in Europe and the USA joined Kirkby’s team, including Henrik Svensmark and colleagues at the Danish Space Research Institute (now called the Danish National Space Center).” This new project is designed to be more sophisticated than the SKY Experiment, and should be up and running in 2010.
The 111-page long CLOUD proposal reads,
“The primary scientific goals of the CLOUD experiment are as follows:
1. To study the link between cosmic rays and the formation of large ions, aerosol particles, cloud droplets, and ice crystals.
2. To understand the microphysical mechanisms connecting cosmic rays to changes in
aerosol and cloud particle properties.
3. To simulate the effects of cosmic rays on aerosol and cloud properties under atmospheric conditions.”
So we’ve established the physical mechanisms that drive this theory, but we haven’t yet explored the ramifications of it. By comparing trends in the Earth’s temperature and GCR, it seems to suggest that the solar modulation of cosmic rays could be the primary driver of climate on the decadal scale, the millenial scale, and even the multi-million year scale.
A Cosmic Signal in the Icehouse Cycle
Higher levels of cosmic ray flux seem to correspond with the Icehouse cycle, which is characterized by a 100 million year cycle composed of warm periods (hothouses or greenhouses), when no ice or snow exists on Earth, and icehouses, when the Earth bounces back and forth between today’s climate and ice ages.


What may lend credence to this idea is the fact that the Earth passes through the spiral arms of Milky Way every 100 million years. In the arms of the milky, there are m any large, shortlived stars forming and imploding in supernovae. These supernovae send energized cosmic rays hurdling towards the Earth to create clouds and cool the atmosphere. According to Dr. Nir J. Shaviv, cosmic ray fluctuation can explain over 2/3 of the observed temperature variation on this large scale. Our solar system, while rotating through the arms of the Milky Way, also wobbles up and down, through the relatively flat concentration of cosmic activity every 34 million years. According to the Danish National Space Center, “More frequent chilling events, every 34 million years or so, occur whenever the solar system passes through with the mid-plane of the Galaxy.”
 any large, shortlived stars forming and imploding in supernovae. These supernovae send energized cosmic rays hurdling towards the Earth to create clouds and cool the atmosphere. According to Dr. Nir J. Shaviv, cosmic ray fluctuation can explain over 2/3 of the observed temperature variation on this large scale. Our solar system, while rotating through the arms of the Milky Way, also wobbles up and down, through the relatively flat concentration of cosmic activity every 34 million years. According to the Danish National Space Center, “More frequent chilling events, every 34 million years or so, occur whenever the solar system passes through with the mid-plane of the Galaxy.”
Dr. Shaviv has also expressed the possibility that the GCR theory could explain the “Faint Sun Paradox,” the idea that the Earth should have been frozen 4.5 Billion years ago because the total solar output was 30% less than it is today due to the natural processes of the sun. A new sun would rotate faster, creating more solar wind, blocking more cosmic rays, preventing a large amount of cloud cover, and allowing increased warming. According to Shaviv, this phenomenon, coupled with changes in greenhouse gas concentrations could explain the paradox put forth by Carl Sagan.
A Cosmic Signal in Modern Climate 
To determine if temperature and cosmic ray flux correspond over the past millennium, we need to determine what temperature reconstruction to use. I have written one post (with more to come) criticizing Michael Mann’s “hockey stick” reconstruction for being methodologically unsound, intellectually dishonest, and absolutely corrupted by tricky statistical methods, and in its place, I will use Loehle’s 2007 reconstruction, which uses no tree rings, and every set of data has been peer-reviewed and adjusted for local temperature (a feat that has never been accomplished before in paleoclimatology). Loehle’s reconstruction shows a strong warm signal during the Medieval Warm Period (MWP) (900-1300 AD) and a strong cold signal during the Little Ice Age (LIC) (1400-1850). Cosmic ray bombardment d ata shows a very strong correlation with these trends; as shown by the graph, during the MWP, GCR bombardment was especially low, and during the LIC, GCR bombardment was especially high. This correlation that implies GCR flux is the dominant force in cloud cover over long time periods came as somewhat of a surprise. It is important to note that temperatures during the coldest part of the LIC follow the same trend as the solar-modulated GCR flux, rather than TSI itself. Although it seemed possible that changes in GCR flux could significantly alter decadal changes in cloud cover, the suggestion that it could dominate multi-decadal, millennial, and even geological cloud cover despite the massive climate forces and cycles at work is unbelievable, yet, at the same time, the evidence is there to confirm it.

To determine if temperature and cosmic ray flux correspond over the past millennium, we need to determine what temperature reconstruction to use. I have written one post (with more to come) criticizing Michael Mann’s “hockey stick” reconstruction for being methodologically unsound, intellectually dishonest, and absolutely corrupted by tricky statistical methods, and in its place, I will use Loehle’s 2007 reconstruction, which uses no tree rings, and every set of data has been peer-reviewed and adjusted for local temperature (a feat that has never been accomplished before in paleoclimatology). Loehle’s reconstruction shows a strong warm signal during the Medieval Warm Period (MWP) (900-1300 AD) and a strong cold signal during the Little Ice Age (LIC) (1400-1850). Cosmic ray bombardment d
 ata shows a very strong correlation with these trends; as shown by the graph, during the MWP, GCR bombardment was especially low, and during the LIC, GCR bombardment was especially high. This correlation that implies GCR flux is the dominant force in cloud cover over long time periods came as somewhat of a surprise. It is important to note that temperatures during the coldest part of the LIC follow the same trend as the solar-modulated GCR flux, rather than TSI itself. Although it seemed possible that changes in GCR flux could significantly alter decadal changes in cloud cover, the suggestion that it could dominate multi-decadal, millennial, and even geological cloud cover despite the massive climate forces and cycles at work is unbelievable, yet, at the same time, the evidence is there to confirm it.
Finally! How is this relevant to today’s climate change debate?
In short, it flies in the face of the enhanced greenhouse effect hypothesized by numerous federal agencies, many climate scientists, the UN, and the liberal media. While some warming remains to be explained, the discovery of this cosmic connection lends credibility to the idea that solar variability is a first-order climate forcing. Although I should refrain from making broad, overarching statements, I’m going to go ahead and say that at least 70% of all changes in temperature up until 1980 can be attributed to changes in the solar magnetic field and thus GCR flux. This theory, coupled with increased pollution, even explains the somewhat mysterious global cooling experienced during the post-WW2 era. It is after 1980 that things become slightly more complex. GCR flux, following Solar magnetic field intensity, has continued in its ten-year cycle, but the amplitude of the cycle has remained unchanged, and no upward shift in the cycle has occurred. Over at Real Climate, they claim this as evidence to discredit the entire idea, though they do admit it is an issue that deserves attention. Increasing levels of CO2, global brightening (the reversal of global dimming through the disintegration of post-WW2 aerosol pollutants), and the recent large collective magnitude of the oceanic cycles could all explain recent warming, though increased CO2 levels are most likely playing a greater role in temperature variations.
What does this mean for the future?
http://science.nasa.gov/headlines/y2006/10may_longrange.htm
The 2022 solar sunspot cycle maximum is expected to be extremely weak. While not a perfect correlation, low solar susnpot activity generally goes along with low solar wind intensity. Expect colder weather.
Sources:
Dr. Shaviv's work and information athttp://www.sciencebits.com/ice-ages
Dr. Henrik Svensmark's work at http://www.dsri.dk/~hsv/
The Danish National Space Center at http://www.spacecenter.dk/
Dr. Henrik Svensmark's work at http://www.dsri.dk/~hsv/
The Danish National Space Center at http://www.spacecenter.dk/


 For the majority of the Earth’s post-Cambrian explosion life, it has been warmer than it is today. In fact, during these warm “green houses,” there is not a single frozen lake or snowflake on Earth. In between “green houses” exist the “ice houses,” of which there have been three, and humans inhabit the third. Ice houses last 30 to 50 million years; ours is 20 million years old, so no need to worry about that for at least another 10 million years. The graph below shows the Earth sliding out of the last “green house,” specifically the Eocene Maximum, and into the “ice house” that we now inhabit.

